The Canyons Endurance Runs by UTMB - 100K - Elevation Profile, Aid Stations and Cutoffs
- China Wall Trailhead, Foresthill, California, USA
- 100 km62.1 mi
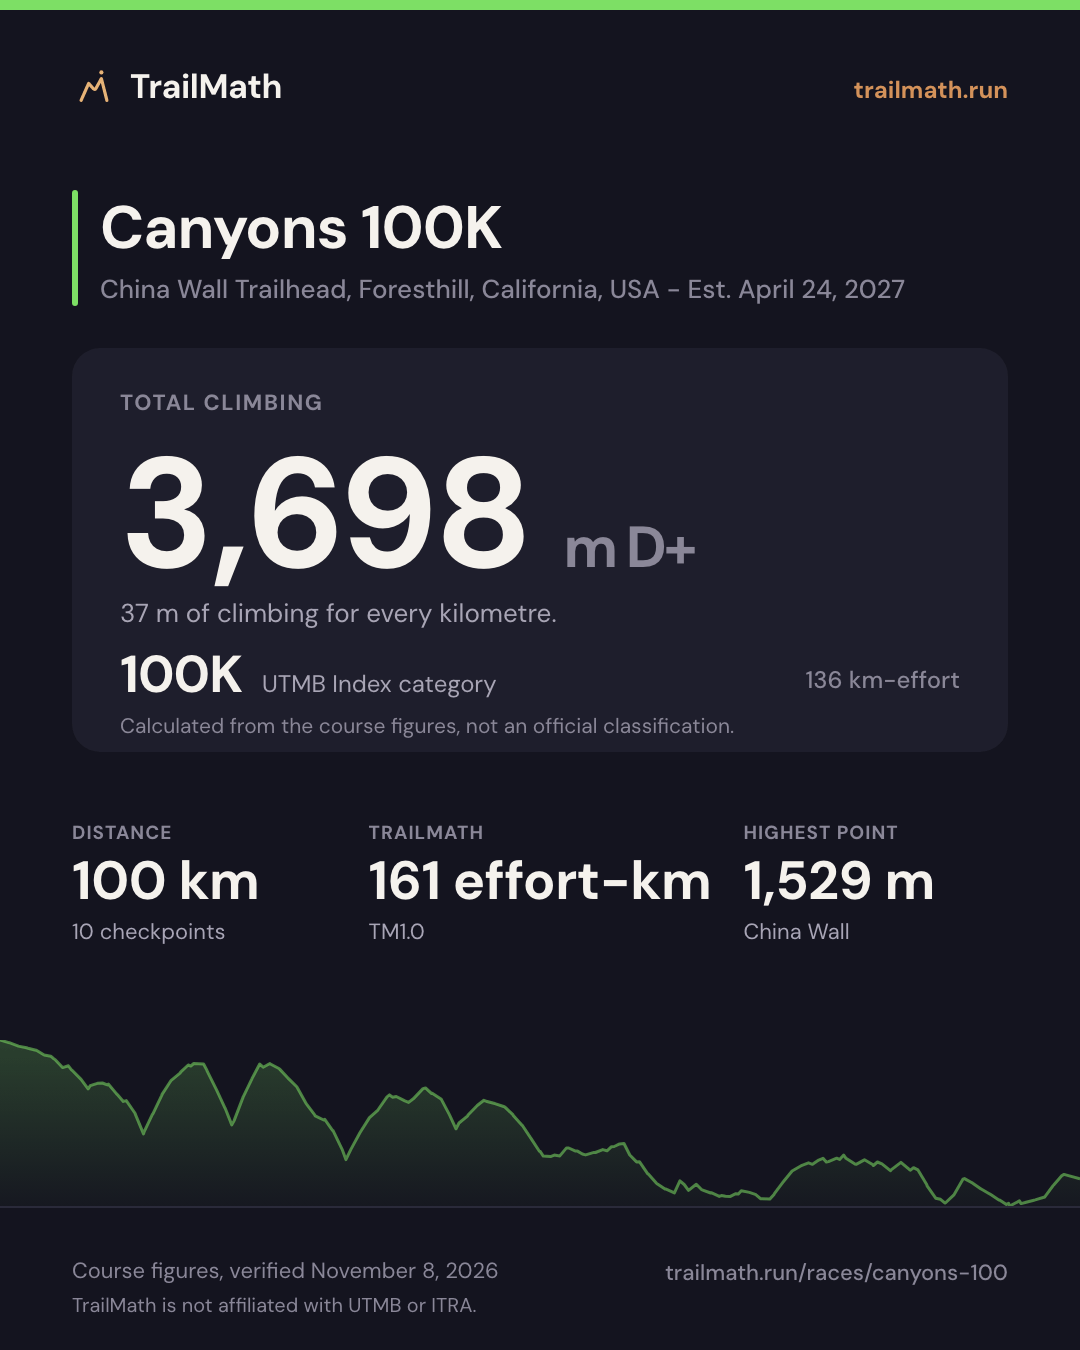
- 3,698 m12,133 ft D+
- 8 aid stations
- 6 Running Stones - Major
Map, checkpoints and cutoffs Map · checkpoints · forecast opens Apr 15 Race-day forecast is live
Race-day conditions
Weather and daylight along the course and at all 10 checkpoints, set to the 05:00 start.
- Start
- 05:00
- Daylight at the start
- 06:13-19:47
- Aid stations
- 8
Course profile
China Wall Trailhead, Foresthill, California, USADowntown Auburn, California, USA· point-to-point
Download the official GPX- Distance
- 100 km62.1 miFinishes 1,140 m lower than it startsFinishes 3,740 ft lower than it starts
- Elevation
- +3,698 m+12,133 ft-4,838 m-15,873 ftAbout 37 m of climb per kmAbout 195 ft of climb per mile
- Highest point
- 1,529 m5,016 ftChina Wall
Next editionEst. Sat 24 Apr 2027
Our estimate for Sat 24 Apr 2027. The organiser has not announced the date for this race yet.
- Start
- SunriseDowntown Auburn, California, USA1h16 after the start
- Winner~8h198h19 after the start
- SunsetDowntown Auburn, California, USA14h49 after the start
- Median finisher2026 median15h56 after the start
- Cutoff20h after the start
A median finisher runs 2h22 in the dark.
The Canyons Endurance Runs by UTMB - 100K is a 100 km (about 62 miles) ultra-trail with around 3,698 m of elevation gain, starting in China Wall Trailhead, Foresthill, California, USA. The overall cutoff is 20 hours. The highest point on the course is China Wall at 1,529 m. That is 37 m of climbing per kilometre. The Canyons Endurance Runs by UTMB has 4 races, from 25 to 161 km; this one ranks 2 of 4 by distance and 1 of 4 by climbing per kilometre.
The biggest climb between checkpoints gains around 671 m from Start - China Wall (km 0) to Deadwood - 1 (km 18). The steepest sustained section on the elevation profile averages about 19% over roughly 2.6 km around km 23. Crew access is allowed at Michigan Bluff (36.4 km), Foresthill (45.9 km) and Drivers Flat (74 km). Drop bags are available at Foresthill.
Data is approximate and courses change between editions - always verify against the official race guide.
Other distances at The Canyons Endurance Runs by UTMB
| Race | Distance | D+ | Cutoff | Next start |
|---|---|---|---|---|
| Canyons 100M | 161 km100 mi | 5,500 m18,045 ft | 35h00 | Apr 23, 2027 (est.) |
| Canyons 100K (this page) | 100 km62.1 mi | 3,698 m12,133 ft | 20h00 | Apr 24, 2027 (est.) |
| Canyons 50K | 50 km31.1 mi | 1,553 m5,095 ft | 10h00 | Apr 24, 2027 (est.) |
| Canyons 25K | 25 km15.5 mi | 762 m2,500 ft | 5h00 | Apr 23, 2027 (est.) |
Plan against the cutoffs
Prepare every aid station against the official cutoffs, then unlock your full roadbook in the app.
Estimate your finish
One Strava connection reads your last 90 days and estimates your finish on this course. Free, no plan needed.


Course math
Four numbers worked out from this course's distance, elevation and checkpoints.
TrailMath effort-km
161 effort-km
About 16 h for a mid-pack finisher (index 500). Not a pacing guarantee.
Distance + gain ÷ 100 + loss ÷ 200, beside ITRA's gain-only km-effort. Model TM1.0.
How TrailMath works →UTMB Index category
100K
136 km-effort (distance + gain ÷ 100). Calculated from the course figures, not an official classification.
Estimate your UTMB Index → ITRA and UTMB indexes explainedBiggest climb section
+671 m+2,201 ft
China Wall → Deadwood - 1 · km 0–18mi 0–11.2
The largest gain between two checkpoints, not one continuous climb.
Biggest descent section
−883 m−2,897 ft
China Wall → Deadwood - 1 · km 0–18mi 0–11.2
The largest loss between two checkpoints. ITRA's km-effort ignores descent; TrailMath counts it: 161 km-effort.
Open in GPX Explorer →Share this race
Cards sized for Instagram and Strava.
The Canyons Endurance Runs by UTMB - 100K · 2026
Finish times, 2026 edition
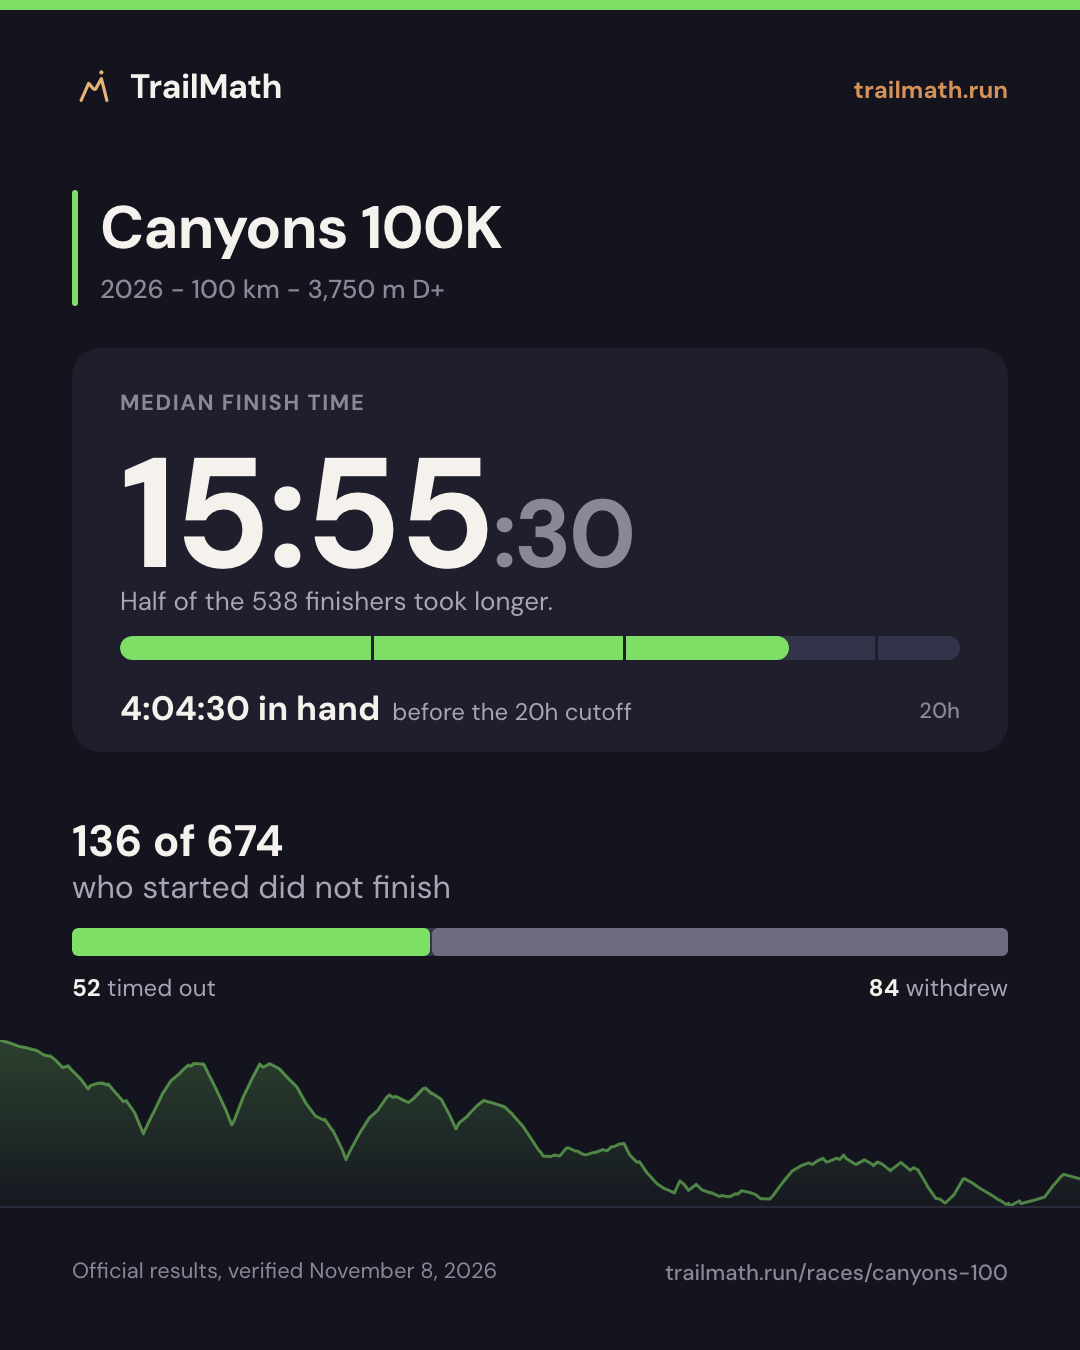
674 runners started. 538 came back. Half of them took longer than 15:55:30.That left the median finisher 4:04:30 inside the 20h cutoff.
Median finish
15:55:30
Half of the 538 finishers were still out there at this point.
4:04:30in hand before the 20h cutoff
Average 15:39:18, 0:16:12 quicker than the median: a fast front pulls it down.
The start line
79.8%
538 of 674 starters made it; 136 did not.
still moving when a cutoff closed
stopped by choice or by the medics
Men and women
Two medians on the same scale. The bars run from the start to the cutoff, so the gap between them is the gap in time.
Men
15:47:43
median finish; average 15:32:42
405 finishers, 75% of the field
Women
16:11:39
median finish; average 15:59:22
133 finishers, 25% of the field
0:23:56 separates the two medians, across 405 men and 133 women.
Finish time by age group
Every track runs from the start to the 20h cutoff, so the empty part of a bar is the time that group's median finisher still had. Men and women are drawn on the same scale.
| Age | Median finish | Median against the cutoff | Finishers |
|---|---|---|---|
| 20-34 | 14:12:21 | 118 | |
| 35-39 | 15:19:39 | 75 | |
| 40-44 | 15:41:37 | 71 | |
| 45-49 | 16:05:22 | 55 | |
| 50-54 | 17:01:13 | 43 | |
| 55-59 | 17:21:08 | 22 | |
| 60-64 | 18:37:05 | 16 - small sample, read with care | |
| 65-69 | 17:36:14 | 5 - small sample, read with care |
| Age | Median finish | Median against the cutoff | Finishers |
|---|---|---|---|
| 18-19 | - | 1 - too few finishers to publish a time | |
| 20-34 | 15:59:41 | 37 | |
| 35-39 | 14:59:50 | 25 | |
| 40-44 | 16:18:26 | 22 | |
| 45-49 | 16:48:22 | 28 | |
| 50-54 | 17:49:02 | 15 - small sample, read with care | |
| 55-59 | 18:46:28 | 3 - small sample, read with care | |
| 60-64 | - | 2 - too few finishers to publish a time |
Full bar: 20 finishers or more. Tick alone: fewer than 20, too few for a median to say much. The shaded row is the biggest group.
Where the finishers came from
81% of the finishers came from United States alone.
| Nation | Finishers | Share |
|---|---|---|
| United StatesUS | 43580.9% | |
| CanadaCA | 336.1% | |
| ChinaCN | 112.0% | |
| FranceFR | 91.7% | |
| BrazilBR | 61.1% | |
| GermanyDE | 40.7% | |
| IndiaIN | 40.7% | |
| MexicoMX | 40.7% | |
| BelgiumBE | 30.6% | |
| SwitzerlandCH | 30.6% | |
| United KingdomGB | 30.6% | |
| GuatemalaGT | 20.4% | |
| IrelandIE | 20.4% | |
| AustraliaAU | 10.2% | |
| BulgariaBG | 10.2% | |
| EthiopiaET | 10.2% | |
| FinlandFI | 10.2% | |
| HungaryHU | 10.2% | |
| ItalyIT | 10.2% | |
| JapanJP | 10.2% | |
| MalaysiaMY | 10.2% | |
| NorwayNO | 10.2% | |
| New ZealandNZ | 10.2% | |
| PanamaPA | 10.2% | |
| PolandPL | 10.2% | |
| Puerto RicoPR | 10.2% | |
| SingaporeSG | 10.2% | |
| El SalvadorSV | 10.2% | |
| UkraineUA | 10.2% | |
| South AfricaZA | 10.2% | |
| 20 other nations10 other nationsAll other nations | 264.8%122.2%20.4% |






























Showing 20 of 30 nations.Showing 30 of 30 nations.Showing 30 of 30 nations.
Bar length is against the largest nation. The smallest counts are drawn at a minimum visible width, so their bars are not to scale.
How these numbers were computed
These are times for runners who finished. They exclude everyone who started and did not, so they describe how long finishing took, not how long the race takes. Bands with only a handful of finishers move a lot from one edition to the next.
We plot the median, not the average. A handful of very quick runners drags the average well below the time half the field actually beat, so the median is the honest number to plan against.
Nationality here shows who travels to this race, not who runs it best. That alone is why a host nation tops almost every list.
Computed from the full official results, verifiedNovember 8, 2026 - Official results
Ask the course
Ask Canyons 100K anything about climbs, pacing, crew or cutoffs.
Answers come from this course's data, your plan and your training.
Which climb should I respect most?
China Wall to Deadwood - 1: +671 m over 18 km, straight from the gun. Hike the steep sections at an effort you could hold for hours - the race is decided after this climb, not on it.
Where can my crew meet me?
Michigan Bluff, km 36.4 - the first of 3 crew points. The next is Foresthill, km 45.9.
Is 15h a realistic finish for me?
15h would put you in the faster half of 2026 finishers - the median was 15:55:30. It means holding 9:00/km overall.
The assistant answers that once it can see your training.
Build your Canyons 100K plan and your question is the first thing waiting in the TrailMath Assistant.
Build my Canyons 100K planYearly has a 7-day free trial for eligible customers, or take a Race Pass for this race.
To answer this for you, the Course Assistant uses your training and your race plan.
Example answer
Your long runs peak at 30 km, so the plan builds to 4-hour long runs.
Yearly has a 7-day free trial for eligible customers, or take a Race Pass for this race.
Try asking Canyons 100K
Ask anything - we'll open your Canyons 100K plan with your question ready.
Loading the Course Assistant
See your training shape
Pick your weekly volume and training days to preview the plan structure - no account needed.
~25 weeks · peak ~8 h/week · 5 run + 2 strength days
For a 100 km race, aim for about 12 h/week at peak. Set your availability to 14 h/week in the app for the headroom to build there gradually.
Typical structure for your volume - your live plan adjusts sessions inside each week.
Make this your plan
Create your account to see the full week-by-week plan, then choose how to unlock it.
Aid stations and checkpoints
| Checkpoint | KmMi | Cumulative gain (m)Cumulative gain (ft) | Cumulative loss (m)Cumulative loss (ft) | Cutoff |
|---|---|---|---|---|
| Start - China WallServices not published | 00 | 00 | 00 | - |
| Deadwood - 1 | 1811.2 | 6712,201 | 8832,897 | - |
| Deadwood - 2 | 25.415.8 | 1,2474,091 | 1,4594,787 | Sat 11:30 |
| Michigan BluffCrew | 36.422.6 | 1,7945,886 | 2,2637,425 | Sat 12:45 |
| ForesthillCrewDrop bag | 45.928.5 | 2,1527,060 | 2,6808,793 | Sat 14:30 |
| Cal 2 | 59.136.7 | 2,3737,785 | 3,38411,102 | - |
| Drivers FlatCrew | 7446 | 2,8999,511 | 3,91012,828 | Sat 19:45 |
| Mammoth Bar | 86.753.9 | 3,19910,495 | 4,53514,879 | Sat 22:15 |
| Confluence | 92.757.6 | 3,40611,175 | 4,75415,597 | - |
| Downtown Auburn (Finish)Drop bag | 10062.1 | 3,69812,133 | 4,83815,873 | Sun 01:00 |
Data is approximate and courses change between editions - always verify against the official race guide. Source: official race guide, verifiedNovember 8, 2026 - Official race website
FAQ
How much elevation gain does The Canyons Endurance Runs by UTMB - 100K have?
The Canyons Endurance Runs by UTMB - 100K has around 3,698 m of cumulative elevation gain and 4,838 m of loss over 100 km.
What is the cutoff time for The Canyons Endurance Runs by UTMB - 100K?
The overall The Canyons Endurance Runs by UTMB - 100K cutoff is 20 hours, with intermediate time barriers at major checkpoints. Winning times are typically around 8 hours.
How long is The Canyons Endurance Runs by UTMB - 100K?
The Canyons Endurance Runs by UTMB - 100K covers approximately 100 km (about 62 miles), starting in China Wall Trailhead, Foresthill, California, USA.
What is the highest point of The Canyons Endurance Runs by UTMB - 100K?
The highest point of The Canyons Endurance Runs by UTMB - 100K is China Wall at 1,529 m.
How many aid stations does The Canyons Endurance Runs by UTMB - 100K have and which allow crew?
The checkpoint table lists 8 major aid points between the start and the finish. Crew access is allowed at Michigan Bluff (36.4 km), Foresthill (45.9 km) and Drivers Flat (74 km). Drop bags are available at Foresthill.
Training for this race?
TrailMath builds periodized trail training plans around your goal race.
One Strava connection reads your last 90 days and estimates your finish on this course. Free, no plan needed.